
Price Action Trading Strategy (loss of momentum)
Latest updated videos about Market Data, Entry Strategy, Demarker Indicator, and Sma Trading Strategy, Price Action Trading Strategy (loss of momentum).
There are a lot of price action trading strategies but this one will help you when hitting known levels of support and resistance. Being able to spot this price action loss of momentum will dramatically change the way you analyse.
Price action is king. period.
The trading floor is a new project that I just launched.
World class day trading education and tools
https://www.trdfloor.com/welcome
FunderPro
Start your funded account challenge HERE (20% discount with link)
https://funderpro.com/get-funded-with-tma-and-funderpro
my twitter https://twitter.com/artybryja
For charts Use Trading View
https://www.tradingview.com/?aff_id=113274
New Official Telegram Group
TMA OFFICIAL®
https://t.me/TMAbyArty
Looking for a forex broker?
I use Osprey
https://ospreyfx.com/tradewithtma
regulated broker i recommend is Blueberry markets
https://bit.ly/blueberrytma
Try a $100,000 funded account from OspreyFX
https://ospreyfx.com/tradewithtma
Use coupon code
movingaverage50
To get $50 off
or try FTMO
https://ftmo.com/en/?affiliates=2677
Get a free audio book from audible
https://tmafocus.com/2WyXSqa
Links to the indicators
TMA Overlay
https://www.tradingview.com/script/zX3fvduH-TMA-Overlay/
TMA Divergence indicator
https://tmafocus.com/3nfcEfd
TMA shop
https://shop.spreadshirt.com/themovingaverage/
Get some free stocks from WEBULL
https://tmafocus.com/3p0vatP
also
Get some free stocks from Public
https://tmafocus.com/3GUUojh
Price action describes the characteristics of a security’s price movements. This movement is quite often analysed with respect to price changes in the recent past. In simple terms, price action is a trading technique that allows a trader to read the market and make subjective trading decisions based on the recent and actual price movements, rather than relying solely on technical indicators.
Since it ignores the fundamental analysis factors and focuses more on recent and past price movement, the price action trading strategy is dependent on technical analysis tools.
Many day traders focus on price action trading strategies to quickly generate a profit over a short time frame. For example, they may look for a simple breakout from the session’s high, enter into a long position, and use strict money management strategies to generate a profit. If you’re interested in day trading, Investopedia’s Become a Day Trader Course provides a comprehensive review of the subject from an experienced Wall Street trader. You’ll learn proven trading strategies, risk management techniques, and much more in over five hours of on-demand video, exercises, and interactive content.
Tools Used for Price Action Trading
Since price action trading relates to recent historical data and past price movements, all technical analysis tools like charts, trend lines, price bands, high and low swings, technical levels (of support, resistance and consolidation), etc. are taken into account as per the trader’s choice and strategy fit.
The tools and patterns observed by the trader can be simple price bars, price bands, break-outs, trend-lines, or complex combinations involving candlesticks, volatility, channels, etc.
NOT FINANCIAL ADVICE DISCLAIMER
The information contained here and the resources available for download through this website is not intended as, and shall not be understood or construed as, financial advice. I am not an attorney, accountant or financial advisor, nor am I holding myself out to be, and the information contained on this Website is not a substitute for financial advice from a professional who is aware of the facts and circumstances of your individual situation.
We have done our best to ensure that the information provided here and the resources available for download are accurate and provide valuable information. Regardless of anything to the contrary, nothing available on or through this Website should be understood as a recommendation that you should not consult with a financial professional to address your particular information. The Company expressly recommends that you seek advice from a professional.
*None of this is meant to be construed as investment advice, it’s for entertainment purposes only. Links above include affiliate commission or referrals. I’m part of an affiliate network and I receive compensation from partnering websites. The video is accurate as of the posting date but may not be accurate in the future.
Sma Trading Strategy, Price Action Trading Strategy (loss of momentum).
Why Utilize Technical Indicators?
Assistance and resistance are levels that the marketplace reaches before it turns around. As a result, the stock market was more predictable than numerous specific stocks. We only desire the average to help us identify the trend.
Price Action Trading Strategy (loss of momentum), Explore popular complete videos related to Sma Trading Strategy.
5 Simple Actions – Stock Trading System
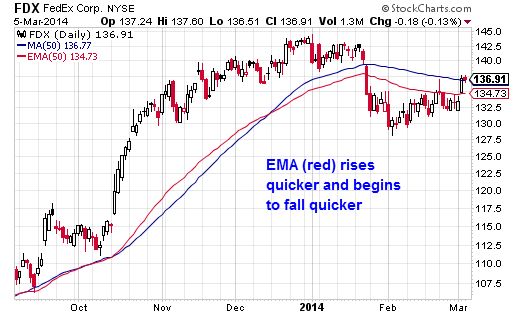
Exponential MAs weigh more recent rates heavier. A 50-day moving average line takes 10 weeks of closing rate information, and then plots the average. This trader loses and his wins are on average, much larger than losing.
In less than four years, the price of oil has risen about 300%, or over $50 a barrel. The Light Crude Constant Contract (of oil futures) hit an all-time high at $67.80 a barrel Friday, and closed the week at $67.40 a barrel. Constantly high oil prices will ultimately slow economic development, which in turn will cause oil costs to fall, ceritus paribus.
However, if there is a breakout through among the outer bands, the cost will tend to continue in the very same direction for a while and robustly so if there is a boost Moving Average Trader in volume.
Technical Analysis uses historic costs and volume patterns to predict future habits. From Wikipedia:”Technical analysis is frequently contrasted with fundamental Analysis, the study of economic aspects that some experts state can influence prices in monetary markets. Technical analysis holds that prices currently reflect all such impacts prior to financiers are aware of them, thus the research study of rate action alone”. Technical Analysts strongly think that by studying historic rates and other crucial variables you can predict the future cost of a stock. Absolutely nothing is absolute in the stock exchange, however increasing your likelihoods that a stock will go the direction you expect it to based on cautious technical analysis is more precise.
It’s tempting to begin trading at $10 or $20 a point just to see just how much money, albeit make-believe cash, you can Forex MA Trading in as short a time as possible. But that’s an error. If you’re to learn how to trade currencies successfully then you must treat your $10,000 of make-believe cash as if it were genuine.
A Forex trading method requires three Stocks MA Trading fundamental bands. These bands are the time frame picked to trade over it, the technical analysis used to determine if there is a cost pattern for the currency pair, and the entry and exit points.
A 50-day moving average line takes 10 weeks of closing price information, and then plots the average. The line is recalculated daily. This will show a stock’s price pattern. It can be up, down, or sideways.
As you can see, defining the BI is easy. The 30-minute BI is strictly the high and the low of the first thirty minutes of trading. I discover that the BI frequently exposes the predisposition of a stock for the day.
Always know your emotions and never ever make a trade out of fear or greed. This is harder than it seems. Many amateur traders will take out of a trade based on what is occurring. However I ensure you this is always bad. To earn money regularly you should build a strategy and stick with it. So be it if this implies setting stops and targets and leaving the room! This might be more difficult to practice than it sounds however unless you get control of your emotions you will never be a successful trader.
You can utilize any indicators that you’re comfy with to go through a similar procedure. To be ahead of the game and on top of the situation, plan ahead for contingency steps in case of spikes.
If you are searching most exciting comparisons related to Sma Trading Strategy, and Forex Trading for Beginners – How to Use Moving Averages to Make Money, Online Broker please join in subscribers database for free.
Related Posts

Tradingview Çoklu İndikatör 1- Hareketli Ortalamalar

Forex Winning Strategy with SMA 21. It's EASY and SIMPLE!!!
 & HOW to use them")
)