
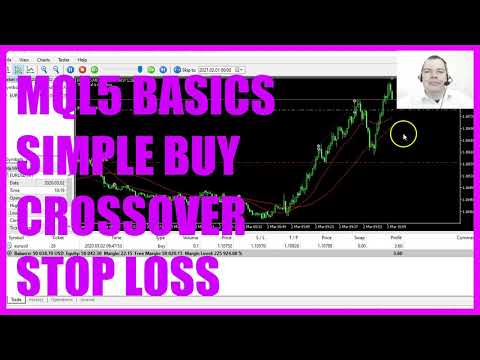
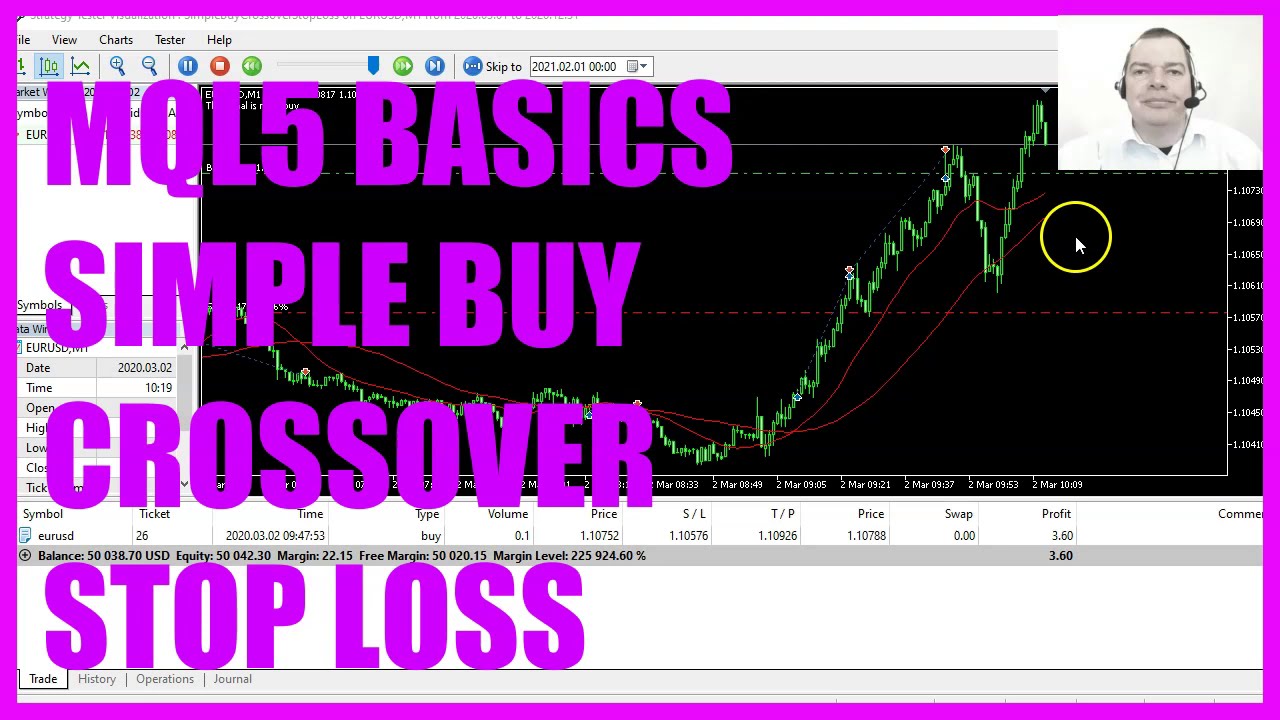
LEARN MQL5 TUTORIAL BASICS – 102 SIMPLE BUY CROSSOVER STOP LOSS
Interesting clips related to Successful Trading, Stock Charting, and Ma Crossover EA, LEARN MQL5 TUTORIAL BASICS – 102 SIMPLE BUY CROSSOVER STOP LOSS.
https://mql5tutorial.com
With MQL5 for Metatrader5 we create an Expert Advisor that is able to open buy trades and close them based on a crossover of two moving averages.
In this video, we are going to open some test positions, buy positions, and those positions will be closed when the crossover of these two moving averages happens. So let’s find out how to do that with MQL5. Please click on the little icon here or press F4 on your keyboard. Now, you should see the Metaeditor window and here you want to click on file, New file, Expert Advisor from Template. I will call this file simple by cross over Stop Loss.
Click on Continue, continue and finish. Now you can delete everything above the ontick function and let’s also remove the two comment lines here. We start by including the file Trade.mqh and we want to create an instance of the class Ctrade that is called trade and will provide some simplified trading functions. We first need to calculate the Ask price. That is done by using Symbolinfodouble for the current symbol on the chart, we want to use symbol, underscore, ask and with Normalize double and underscore digits we automatically calculate the right number of digits behind the dot. Let’s also repeat that for the Bit price. And now we create a string variable for the signal for a crossover.
We need two arrays, one for the small and one for the big moving average.
The small moving average definition is created by using the IMA function for the current symbol on the chart and the currently selected period on that chart, we are going to use twenty candles. No shift value in this case. I’m using ModeUnderscoreSMA for simple moving average.
But you also could use ModeUnderscoreEMA for exponential moving average and the calculation should be done based on the close price. The definition for the big moving average is very similar, but in this case we are using 50 candles. Now we use copybuffer to fill our array for the small and for the big moving average.
According to the two definitions that we have created. We do that for buffer zero from Candle zero. That’s the current candle, and we copy the price data for three candles and store them in the arrays for the small and for the big moving average. And whenever the big moving average array for candle one has a higher value than the small moving average array for candle one, we consider that to be a buy signal. In the other case, if the big moving average array for candle one is bigger than the small moving average array for candle one, that would be a sell signal.
The idea is to close all buy positions for the current currency pair. When we have a sell signal and when the return value for PositionsTotal is bigger than zero. That means we have open buy positions and want to close them, but we need to have something to close. So I’m going to open test positions when the signal equals buy and when we have no open positions, that’s when we are going to use trade.Buy to buy 10 Microlot. In our case, we are using Stop Loss value of 200 points and a Take Profit value of one hundred and fifty points.
Please remember, this is just a test position, you wouldn’t do that on a real account and to see what’s going on, I would like to have a comment statement that will output the text. The current signal is now followed by the signal. Well, this function does not exist, so we need to create it now. The name of the function is close all buy positions this pair. We use void because we don’t require a return value. Inside of the position we are going to use a for loop to count down until there are no positions left.
We need to get the ticket number, that is done by using position get ticket. We want to identify the current currency pair. That can be done by position, get symbol. In both cases we are using the current counter for the current position. Now let’s get the position direction. That is done by using position, get integer and the parameter here is position underscore type. And if the position direction equals position type buy, we have a buy position. Now we want to check if the current symbol on the chart equals the position symbol.
You could use symbol with an underscore, that stands for my current currency pair. And if this is equal to the currency pair for the position that we have identified, we want to use Ctrade dot position close, to close the current position. Now, let’s close the For loop and the function. And this is basically it. If this was too fast for you or if you have no idea what all the code here does, maybe you want to watch one of the other videos in the basic video series or maybe even the Premium Course on our website might be interesting for you.
Ma Crossover EA, LEARN MQL5 TUTORIAL BASICS – 102 SIMPLE BUY CROSSOVER STOP LOSS.
Mastering Trading Methods – The Key To Forex Day Trading Success
The wedge is compressing, which need to continue to produce volatility. It was during my look for the best robotic that I read Marcus B. Your trading plan ought to include what amount of time you are concentrating on.
LEARN MQL5 TUTORIAL BASICS – 102 SIMPLE BUY CROSSOVER STOP LOSS, Watch more videos relevant with Ma Crossover EA.
Know What A Stock Beta Estimation Is
Not just commission but the spread (difference in between purchasing and selling rate). When the for 4 day crosses over the 9 day moving typical the stock is going to continue up and need to be purchased.
When I first became aware of FAP Turbo, I was not delighted because I have actually lost cash trading forex on my own with a particular robotic and without the right tools and techniques. It was during my search for the best robotic that I read Marcus B. Leary declaration of it being the most advanced live trading forex robot capable of doubling your cash every single month. I relied on Marcus and so decided to give it a try by downloading it for $149. Was I pleased with the result? You wager I did. Check out the very best FAP Turbo review listed below before you decide to begin online currency trading using this robotic or any other.
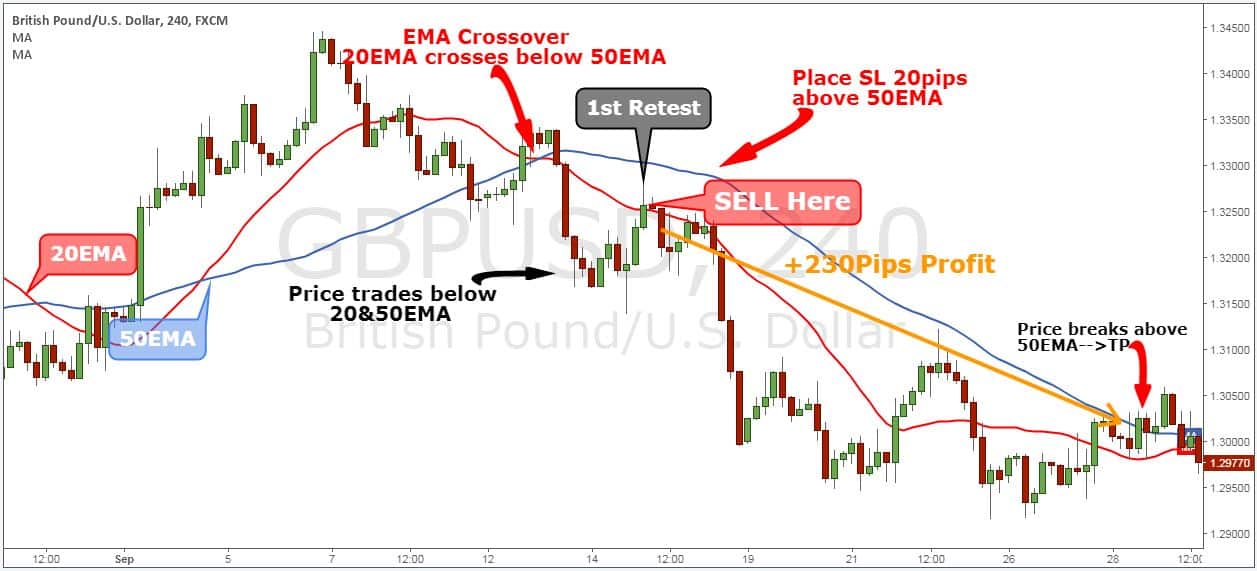
The DJIA needs to stick around its 20-day Moving Average Trader typical if it is going to be viable. The DJIA has to arrive otherwise it might decrease to 11,000. A rebound can result in a pivot point closer to 11,234.
Nasdaq has rallied 310 points in 3 months, and struck a new four-year high at 2,201 Fri morning. The financial data suggest market pullbacks will be restricted, although we’ve entered the seasonally weak period of Jul-Aug-Sep after a big run-up. As a result, there might be a consolidation period rather than a correction over the next few months.
What does that Forex MA Trading tell you about the direction it is heading? Is it in an upward or a down trend? Charts of the main index can tell you this by a fast look. If the line is heading downward then it remains in a downward pattern, however with the disorderly nature of the index price, how do you know if today’s down is not just a glitch and tomorrow it will return up once again?
Among the primary indicators that can assist you develop the method the index is moving is the Moving Typical (MA). This takes the index price over the last specified variety of averages and days it. With each new day it drops the very first price utilized in the previous day’s calculation. If you are looking to day trade or invest, it’s always good to inspect the MA of several durations depending. If you’re seeking to day trade then a MA over 5, 15, and thirty minutes are a good concept. Then 50, 100, and 200 days might be more what you require, if you’re looking for long term investment. For those who have trades lasting a couple of days to a few weeks then durations of 10, 20 and 50 days Stocks MA Trading be better suited.
The very best way to make money is buying and offering breakouts. If you incorporate them in your forex trading strategy you can use them to stack up substantial gains.
Stochastics sign has actually got two lines called %K and %D. Both these lines are outlined on the horizontal axis for an offered time duration. The vertical axis is outlined on a scale from 0% to 100%.
Combining these two moving averages offers you a great foundation for any trading plan. Opportunities are great that you will be able to make money if you wait for the 10-day EMA to agree with the 200-day SMA. Simply use good cash management, do not run the risk of too much on each trade, and you must be great.
Nasdaq has been creating a rising wedge for about 2 years. They do not know proper trading techniques. Now that you’ve tallied the points, what does it imply? It tracks the cost action and always lags behind it.
If you are searching most entertaining comparisons related to Ma Crossover EA, and Forex Trading for Beginners – How to Use Moving Averages to Make Money, Online Broker you are requested to signup in email subscription DB now.
Related Posts

How to Build Best Moving Average Trading Strategy?

EMA Crossover Indicator
