How to build a simple EMA crossover Buy Sell alert system in Excel (Part 1) | 5/13 EMA Crossover
Interesting reviews about Forex Scalping, Complex Indicators, Forex Money Management, Chinese Stocks, and What Is Ema Crossover, How to build a simple EMA crossover Buy Sell alert system in Excel (Part 1) | 5/13 EMA Crossover.
Link to our Telegram Channel – https://t.me/niftybn
Link to our Twitter Profile – https://twitter.com/NiftyBn
In this video, I would teach you how to build a simple EMA crossover Buy Sell alert system in Excel. There would be two parts to this module and this is the first part.
You would be learning the following: what are SMA and EMA? What is the calculation formula for SMA and EMA? What is the difference between SMA and EMA?
SMA stands for Simple Moving Average. It is the average of the closing prices for the time period chosen. The 5-day SMA, for example, is the average of the last 5 closes, including today. Similarly, the 15-day SMA, is the average of the last 13 closes, including today.
In general, longer-term SMAs, such as 100 and 200 day SMA, are more slowly affected by dramatic price swings, whereas shorter-term SMAs, such as 20 and 50 day SMA, will be faster to respond.
SMAs are popular for their ease of ability to illustrate the long-term trend of a security. If the line is trending up, the security is strengthening, whereas a downward trend shows a weakening of that security.
But it has its limitations. It is a lagging indicator that relies on historical data completely. By the time you get to know what the trend really is, it might be too late.
EMA stands for Exponential Moving Average. It is not as simple to calculate as the SMA. It gives more weight to the recent data in comparison to the SMA.
Giving more weight to the most recent data makes the EMA sensitive to the recent price changes.
That is, the EMA gives a higher weight to recent prices, while the SMA assigns equal weight to all values.
The following steps are taken in the calculation of EMA:
Step 1: The calculation needs to start with a simple moving average. The calculation of the SMA is quite straightforward. First, we simply find the closing prices of the underlying for a particular period. Then we divide the total sum of all these prices with the same time period.
Simply put, we find the average of the closing prices of the underlying for a particular period. The 5-day SMA is the average of the last 5 closes, including today.
Step 2: Calculating the EMA requires a multiplier. This is calculated as 2 / ( time period + 1). So if we want to calculate the moving average for a 5 day period we will calculate the multiplier as 2/(5 + 1) = 0.33.
Step 3: Now finally to calculate the EMA we will use the formula – (Closing Price – EMA of the previous day) times the multiplier + EMA of the previous day. For the first time we will use the SMA of the previous day in place of the EMA of the previous day.
Exponential Moving Average crossover is one of the most commonly used technical indicators to identify trend-following trading opportunities.
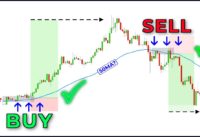
A long trade is entered when the short-term EMA crosses over the longer EMA because it indicates a change in trend. Vice versa is also true. That is, a short trade is entered when the long-term EMA crosses over the shorter EMA.
For this exercise, we will be using the 5-day and the 13-day EMA. A buy signal is triggered when the 5-day EMA crosses above the 13-day EMA and a sell signal is triggered when the 13-day EMA crosses above the 5-day EMA.

What Is Ema Crossover, How to build a simple EMA crossover Buy Sell alert system in Excel (Part 1) | 5/13 EMA Crossover.
Your Forex Trading System – How To Pick One That Isn’t Going To Drive You Nuts
So, when the market is varying, the finest trading strategy is range trading. The MACD/OsMA is simple to study as it is 2 lines that are crossing each other. At least as far as the retail investor is concerned.
How to build a simple EMA crossover Buy Sell alert system in Excel (Part 1) | 5/13 EMA Crossover, Find trending full videos related to What Is Ema Crossover.
Forex Finance – Handle Volatility Or Lose Your Equity
OIH major support is at the (increasing) 50 day MA, presently simply over 108. This system is also known as the “moving typical crossover” system. What does that market inform you about the instructions it is heading?

In my earlier articles, we have found out indications, chart patterns, finance and other pieces of effective trading. In this post, let us evaluate those pieces and puzzle them together in order to find conditions we choose for entering a trade.
The down pattern in sugar futures is well established due to the expectations of a big 2013 harvest that should be led by a record Brazilian harvest. This is news that everyone knows and this basic information has actually attracted excellent traders to the sell side of the market. Technical traders have also had a simple go of it since what rallies there have actually been have been topped perfectly by the 90 day moving average. In reality, the last time the 30-day Moving Average Trader average crossed under the 90-day moving average was in August of last year. Finally, technical traders on the brief side have actually gathered revenues due to the organized decline of the marketplace so far rather than getting stopped out on any spikes in volatility.
Buy-and-hold say the professionals. Buy-and-hold say the consultants who benefit from your financial investment purchases though commissions. Buy-and-hold say most mutual fund companies who benefit from load costs so numerous in range it would take excessive space to list them all here. Buy-and-hold state TV analysts and newsletter publishers who’s clients currently own the stock.
While there is no chance to anticipate what will take place, it does recommend that you need to be prepared in your financial investments to act if the Forex MA Trading begins to head south.
Instead of subscribing to an advisory letter you Stocks MA Trading choose to make up your own timing signal. It will take some initial work, however as soon as done you will not have to pay anyone else for the service.
In addition, if the 5 day moving average is pointing down then keep away, consider an extra product, one where by the 5-day moving average is moving north. When it truly is down listed below its two-hundred day moving average, and do not purchase a trade stock.
Stochastics indication has actually got two lines called %K and %D. Both these lines are plotted on the horizontal axis for a provided period. The vertical axis is plotted on a scale from 0% to 100%.
Do not simply buy and hold shares, at the very same time active trading is not for everyone. Use the 420 day SMA as a line to choose when to be in or out of the S&P 500. When the market falls below the 420 day SMA, traders can likewise look to trade brief.
You just need to have perseverance and discipline. As your stock goes up in cost, there is a crucial line you wish to view. Pivot point trading is simply one of an arsenal of weapons readily available to Forex market individuals.
If you are finding most exciting reviews about What Is Ema Crossover, and Oil Stocks, Two Moving Averages, Pips Currency Trade you should subscribe in a valuable complementary news alert service totally free.


